

Hi there!
I’m Robby Macdonell. I’ve worked in tech startups of all sizes for the better part of two decades. I’ve been a designer, developer, user researcher, product leader, and executive.
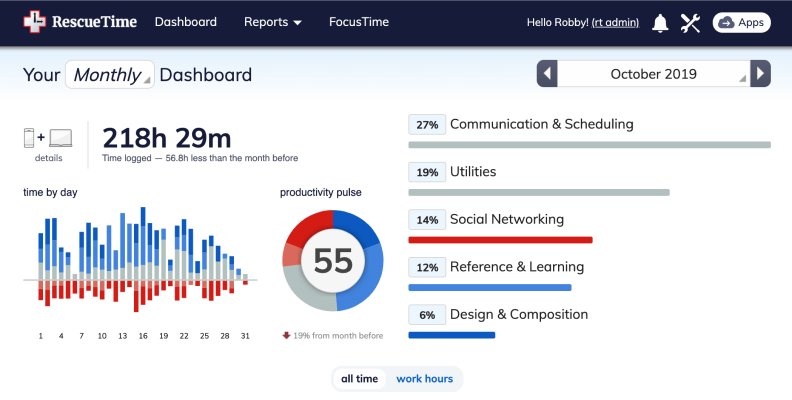
I was most recently the CEO of RescueTime, a personal productivity startup that helps people make the best use of their time so they can focus on their most important work.
I’m currently working on some new ideas and thinking about what the future holds.
I'm from Nashville, Tennessee and currently live in Seattle, Washington. You can find me on Twitter, LinkedIn, Mastodon, or send me an email.
Where I've Been.
I grew up in Nashville skateboarding, painting graffiti on freight trains and playing drums in punk rock bands. In true Music City fashion, I built my first website because my band needed one and none of us knew anyone who could make one for us.
I needed a massive life change, so I packed up everything and moved to Anchorage without doing any research or knowing anything about Alaska. I wasn't prepared for how many moose I'd have to dodge on my morning commute! I worked for a few different web design studios while up there (👋 I miss you, Pango!), with customers ranging from tiny bed and breakfasts to multinational corporations.
I freelanced as a designer and developer for several years in Boston. I worked with great designers (👋 Hi Bob & Kristen!) on really interesting projects, and learned a lot about running a small business. It was valuable experience, but along the way I realized that there’s a lot more to running a solo business than just doing the work I love. Keeping up with the overhead of self-employed life was not for me.
I got to experience the highs and lows of VC-funded startup life for the first time at Jobster, a well funded startup that hired and relocated me to Seattle from Boston. Three weeks after I started, half the company was laid off, and the next few years saw pivots, rebrands, more fundraising, and eventually a firesale acquisition. Despite the outcome, it opened my eyes to the massive impact that a small group of smart people can have when they try to shake up an entire industry.
I was an early employee at Zulily, an ecommerce company that specialized in flash sales for moms, babies, and kids. It was my first exposure to true hypergrowth in a company. They had hit upon an explosive market, and it was as exciting as it was exhausting. Everyone involved moved mountains to keep up with the massive growth. And it worked—the company successfully went public in 2013.
The productivity software startup RescueTime had been started a couple years earlier by several of my friends, and I eventually joined as their head of product. I was able to have a big impact on a lot of people who were struggling to understand their time at work. I learned a lot about SaaS, scaling a product from niche to a larger audience, data analysis, personal productivity, remote teams, and how work gets done–or doesn’t–in the modern workplace.
I took over as CEO of RescueTime’s after it's founder—and a good friend of mine, Joe—was given a terminal cancer diagnosis. Guiding our team through the death of a key team member was a difficult and sad first act as an executive, but it taught me a lot about resilience, empathy, building company culture, and the challenging balance of caring for others while also managing my own mental health.
The last few years burned me out pretty badly, so I gave myself some time to reset, explore new opportunties, and connect with new people. Also a global pandemic happened. That got pretty weird.
I'm back in Seattle, exploring a few new ideas and opportunities.
Some things I've done.

In 2023, I'm thinking a lot about...
Remote Teams And The Modern Workplace
Workers today have easy access to more information than previous generations could have ever dreamed of. This is wonderful and terrible at the same time. People need systems that help them thrive in this new, information-abundant world.
Accessibility
People should be able to use the products I make. Plain and simple. Accessibility and designing so the things I build work well with assitive technolgies has always been a blind spot for me. This year I'm working to correct that.
Nocode / Visual Programming
In startups, being able to ship ideas quickly is an absolute superpower. The recent rise of platforms that let people string together apps with no programming have unlocked huge amounts of creativity.